Gene Set Analysis
BIBS Workshop
Training supports were derived or adapted from great online tutorials. Don’t hesitate to go and see to complete this training:
1 Overview of Gene set analysis methods
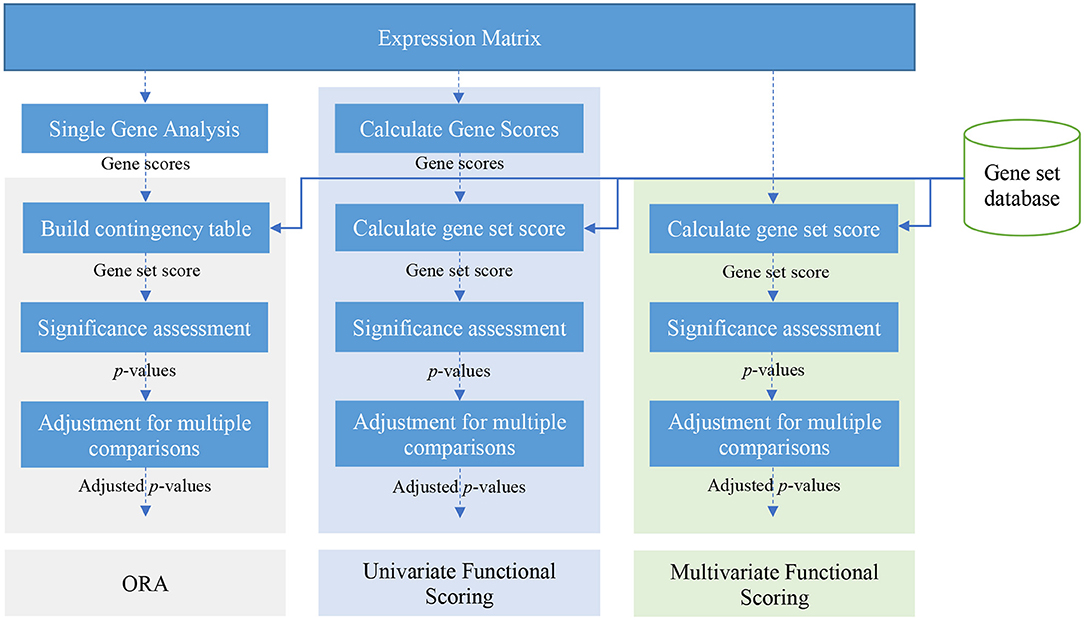
Generally for any differential expression analysis, it is useful to interpret the resulting genes lists using freely available web- and R-based tools. To gain greater biological insight on the differentially expressed genes (DEGs) you may want to determine whether there is enrichment of known biological functions, interactions, or pathways. While tools for functional analysis span a wide variety of techniques, they can loosely be categorized into three main types: over-representation analysis, functional class scoring, and pathway topology [1].
In this training, we will only look at the first two. (If you are interested in pathway topology analysis you can find a review here and a of topology-based methods here.)

Depending on the method you wish to use, you will need the corresponding input data.
- For overrepresention based method you need a gene list (DE, up-regulated genes, down-regulated genes, …) of interest and a background list (the list of genes use as control - “the universe”) .
- From ranking-based method you need all studied genes ranked according a score (for example the logfoldchange).
Note that all tools described below are great tools to validate experimental results and to make hypotheses. These tools suggest genes/pathways that may be involved with your condition of interest; however, you should NOT use these tools to make conclusions about the pathways involved in your experimental process. You will need to perform experimental validation of any suggested pathways.
1.1 Over-Representation Analysis (ORA)
There are a plethora of functional enrichment tools that perform some type of “over-representation” analysis by querying databases containing information about gene function and interactions.
These databases typically categorize genes into groups (gene sets) based on shared function, or involvement in a pathway, or presence in a specific cellular location, or other categorizations, e.g. functional pathways, etc. Essentially, known genes are binned into categories that have been consistently named (controlled vocabulary) based on how the gene has been annotated functionally. These categories are independent of any organism, however each organism has distinct categorizations available.
To determine whether any categories are over-represented, you can determine the probability of having the observed proportion of genes associated with a specific category in your gene list based on the proportion of genes associated with the same category in the background set (gene categorizations for the appropriate organism).


The statistical test that will determine whether something is actually over-represented is the Hypergeometric test.
Using the example of the first functional category above, hypergeometric distribution is a probability distribution that describes the probability of 25 genes (k) being associated with “Functional category 1”, for all genes in our gene list (n=1000), from a population of all of the genes in entire genome (N=13,000) which contains 35 genes (K) associated with “Functional category 1”.
The calculation of probability of k successes follows the formula:

This test will result in an adjusted p-value (after multiple test correction) for each category tested.
1.2 Ranking-based method/Functional Class Scoring (FCS) (ex: GSEA)
In addition to over-representation analysis, there are other types of analyses can be equally important or informative for obtaining some biological insight from your results. The hypothesis behind functional class scoring (FCS) methods is that although large changes in individual genes can have significant effects on pathways (and will be detected via ORA methods), weaker but coordinated changes in sets of functionally related genes (i.e., pathways) can also have significant effects. Thus, rather than setting an arbitrary threshold to identify ‘significant genes’, all genes are considered in the analysis. The gene-level statistics from the dataset are aggregated to generate a single pathway-level statistic and statistical significance of each pathway is reported. This type of analysis can be particularly helpful if the differential expression analysis only outputs a small list of significant DE genes.

1.2.1 Gene set enrichment analysis using clusterProfiler and Pathview
One commonly used tool which is classified under Functional class scoring (FCS), is GSEA. Gene set enrichment analysis utilizes the gene-level statistics or log2 fold changes for all genes to look to see whether gene sets for particular biological pathways are enriched among the large positive or negative fold changes.
Gene sets are pre-defined groups of genes, which are functionally related. Commonly used gene sets include those derived from KEGG pathways, Gene Ontology terms, MSigDB, Reactome, or gene groups that share some other functional annotations, etc.

This image describes the theory of GSEA, with the ‘gene set S’ showing the metric used (in our case, ranked log2 fold changes) to determine enrichment of genes in the gene set. The left-most image is representing this metric used for the GSEA analysis. The log2 fold changes for each gene in the ‘gene set S’ is shown as a line in the middle image. The large positive log2 fold changes are at the top of the gene set image, while the largest negative log2 fold changes are at the bottom of the gene set image. In the right-most image, the gene set is turned horizontally, underneath which is an image depicting the calculations involved in determining enrichment, as described below.
Step 1: Calculation of enrichment score:
An enrichment score for a particular gene set is calculated by walking down the list of log2 fold changes and increasing the running-sum statistic every time a gene in the gene set is encountered and decreasing it when genes are not part of the gene set. The size of the increase/decrease is determined by magnitude of the log2 fold change. Larger (positive or negative) log2 fold changes will result in larger increases or decreases. The final enrichment score is where the running-sum statistic is the largest deviation from zero.
Step 2: Estimation of significance:
The significance of the enrichment score is determined using permutation testing, which performs rearrangements of the data points to determine the likelihood of generating an enrichment score as large as the enrichment score calculated from the observed data. Essentially, for this step, the first permutation would reorder the log2 fold changes and randomly assign them to different genes, reorder the gene ranks based on these new log2 fold changes, and recalculate the enrichment score. The second permutation would reorder the log2 fold changes again and recalculate the enrichment score again, and this would continue for the total number of permutations run. Therefore, the number of permutations run will increase the confidence in the signficance estimates.
Step 3: Adjust for multiple test correction
After all gene sets are tested, the enrichment scores are normalized for the size of the gene set, then the p-values are corrected for multiple testing.
The GSEA output will yield the core genes in the gene sets that most highly contribute to the enrichment score. The genes output are generally the genes at or before the running sum reaches its maximum value (eg. the most influential genes driving the differences between conditions for that gene set).
1.3 Gene sets databases
A gene set is an unordered collection of genes that are functionally related. A pathway can be interpreted as a gene set by ignoring functional relationships among genes.
1.3.1 Gene Ontology (GO)
Gene Ontology defines concepts/classes used to describe gene function, and relationships between these concepts. It classifies functions along three aspects:
- MF: Molecular Function molecular activities of gene products
- CC: Cellular Component where gene products are active
- BP: Biological Process pathways and larger processes made up of the activities of multiple gene products
GO terms are organized in a directed acyclic graph, where edges between terms represent parent-child relationship.

GO term hierarchy
Some gene products are well-researched, with vast quantities of data available regarding their biological processes and functions. However, other gene products have very little data available about their roles in the cell.
For example, the protein, “p53”, would contain a wealth of information on it’s roles in the cell, whereas another protein might only be known as a “membrane-bound protein” with no other information available.
The GO ontologies were developed to describe and query biological knowledge with differing levels of information available. To do this, GO ontologies are loosely hierarchical, ranging from general, ‘parent’, terms to more specific, ‘child’ terms. The GO ontologies are “loosely” hierarchical since ‘child’ terms can have multiple ‘parent’ terms.
Some genes with less information may only be associated with general ‘parent’ terms or no terms at all, while other genes with a lot of information be associated with many terms.
1.3.2 Kyoto Encyclopedia of Genes and Genomes (KEGG)
KEGG is a collection of manually drawn pathway maps representing molecular interaction and reaction networks. These pathways cover a wide range of biochemical processes that can be divided into 7 broad categories:
- Metabolism
- Genetic information processing
- Environmental information processing
- Cellular processes
- Organismal systems
- Human diseases
- Drug development.
Available pathways are listed: here.

1.3.3 Other gene sets
GO and KEGG are the most frequently used for functional analysis. They are typically the first choice because of their long-standing curation and availability for a wide range of species.
Other gene sets include but are not limited to Disease Ontology (DO), Disease Gene Network (DisGeNET), wikiPathways, Molecular Signatures Database (MSigDb).
1.3.4 User defined gene sets (GMT files)
The GMT file format is a tab delimited file format that describes gene sets. In the GMT format, each row represents a gene set; in the GMX format, each column represents a gene set.

2 Practicals
2.1 Get “toy” data
In this training, we will used the result of a differential expression analysis described in Kenny PJ et al, Cell Rep 2014.
The RNA-Seq was performed on HEK293F cells that were either transfected with a MOV10 transgene, or siRNA to knock down Mov10 expression, or non-specific (irrelevant) siRNA. This resulted in 3 conditions Mov10 oe (over expression), Mov10 kd (knock down) and Irrelevant kd, respectively. The number of replicates is as shown below.
Using these data, the authors evaluate transcriptional patterns associated with perturbation of MOV10 expression. Please note that the irrelevant siRNA will be treated as our control condition.

What is the purpose of these datasets? What does Mov10 do?
The authors are investigating interactions between various genes involved in Fragile X syndrome, a disease in which there is aberrant production of the FMRP protein.
FMRP is “most commonly found in the brain, is essential for normal cognitive development and female reproductive function. Mutations of this gene can lead to fragile X syndrome, mental retardation, premature ovarian failure, autism, Parkinson’s disease, developmental delays and other cognitive deficits.” - from wikipedia
MOV10, is a putative RNA helicase that is also associated with FMRP in the context of the microRNA pathway.
The hypothesis the paper is testing is that FMRP and MOV10 associate and regulate the translation of a subset of RNAs.
2.2 Result files
Up regulated genes between MOV10 over expressed samples and control samples: here
Down regulated genes between MOV10 over expressed samples and control samples: here
Differentially (up + down) expressed genes between MOV10 over expressed samples and control samples: here
All the studied genes = background genes list here
The complete result of the differential expression analysis, with gene identifiers, logfoldchange values and pvalue adjusted: here
Download all these files on your computer.
2.3 Web tools
In a first part, we will conduct an over representation analysis (ORA) using a web app.
There are several solutions as gprofiler, DAVID, …
Here, we will use gprofiler: https://biit.cs.ut.ee/gprofiler/gost
2.3.1 gprofiler
- Go on gprofiler website and make an analysis on the DEG list
- Upload the “DEG_list.txt
- On the right, in Data sources select only GO databases and Kegg
- Click on Run query
- In a new page, do the same thing but add a background list
- Upload the “DEG_list.txt”
- On the right, in Data sources select only GO databases and Kegg
- Click on Advanced options
- Choose Custom in Statistical domain scope and upload the background_list.txt
- Click on Run query
- Compare the results
Depending on the background list, ORA results can vary considerably!
So, for a reproducible science, it is important to provide:
- the used tools/app and its version
- the code or the instructions
- the used databases and its versions
- the genes list of interest and the background
2.4 Using a more reproducible way (command lines)
Now we’re going to do the same analysis in a more reproducible way. For that we will use the clusterprofiler R package which combines:
- Over-Representation Analysis
- Ranking-based method
- Most used databases
- and visualization functions!
- Create a working directory (GSA_BIBS_training)
- Download the code template file available here and put it in “GSA_BIBS_training”
- Create a “data” directory and a “results” directory
- In the data directory, put the complete result “DE_result_table.tsv” of the differential expression analysis available here
Your working directory should look like this:
GSA_BIBS_training/
├── data/
│    └──DE_complete_results.tsv
├── GSA_template.Rmd
└── results/Depending on the parameters used and/or the methods used, Gene Set Analysis results can vary considerably!
-> keeping track of all the commands/instructions that generate your results is very important (the use of a script is strongly recommended)
##Important2
All tools described today are great tools to validate experimental results and to make hypotheses. These tools suggest genes/pathways that may be involved with your condition of interest; however, you should NOT use these tools to make conclusions about the pathways involved in your experimental process. You will need to perform experimental validation of any suggested pathways.
2.5 Time to work on your data
3 Ressources
- Tips for working with GO terms: http://journals.plos.org/ploscompbiol/article?id=10.1371/journal.pcbi.1003343
- Urgent need for consistent standards in functional enrichment analysis: https://journals.plos.org/ploscompbiol/article?id=10.1371/journal.pcbi.1009935
- Gene Set Analysis: Challenges, Opportunities, and Future Research: https://www.frontiersin.org/articles/10.3389/fgene.2020.00654/full
- Interpreting omics data with pathway enrichment analysis: https://doi-org.insb.bib.cnrs.fr/10.1016/j.tig.2023.01.003
These materials have been developed by members of BIBS team of the CIRI (https://ciri.ens-lyon.fr/). These are open access materials distributed under the terms of the Creative Commons Attribution license (CC BY 4.0), which permits unrestricted use, distribution, and reproduction in any medium, provided the original author and source are credited.
- Some materials used in these lessons were derived or adapted from work made available by the Harvard Chan Bioinformatics Core (HBC) (https://github.com/hbctraining) under the Creative Commons Attribution license (CC BY 4.0).